WordPress Plugin for Garmin FIT Files
ShowFitFile is a WordPress Plugin to display FIT, GPX and TCX files as part of a blog. These files are usually generated by fitness watches and bike computers, such as those from Garmin, Polar and Suunto. The files contain all the information about a training session, such as route, speed, distance and data from sensors such as power meters and heart rate monitors.
This plugin displays the route information on a map, along with the event’s start time, distance, altitude gained & lost, and duration.
Time: 16/06/2019, 10:48 |
Duration: 03:56:25 |
Ascent/Descent:  1065 m 1065 m  1032 m 1032 m | Distance: 86.47 km |
The plugin is simple to install and uses either a Gutenberg block or a shortcode to display its information.
Installation
Via WordPress Plugin Directory
The simplest way to install the plugin is from the WordPress Plugin Directory.
- Go to the 'Plugins' section of your WordPress Admin page, and click on 'Add New'.
- On the 'Add Plugins' page, enter 'ShowFitFile' in the search box on the right-hand side, and you'll see the Show Fit File plugin displayed.
- Click on the 'Install Now' button, and the plugin will be displayed.
Downloaded Plugin Zip file
You can also download the plugin as a zip file from here: https://stuarttevendale.com/wp-content/uploads/2022/10/showfitfile.zip
- Upload the complete 'showfit' folder to your
/wp-content/plugins/directory - Activate the plugin through the 'Plugins' menu in WordPress
- Upload a .fit file to your Media Library
- Add the ShortCode or Block to your post
Gutenberg Block
The plugin is also available as a Gutenberg Block as part of WordPress's Block Editor. To add ShowFitFile as a block, click the '+' button to display the list of blocks, and type Showfitfile in the search box.
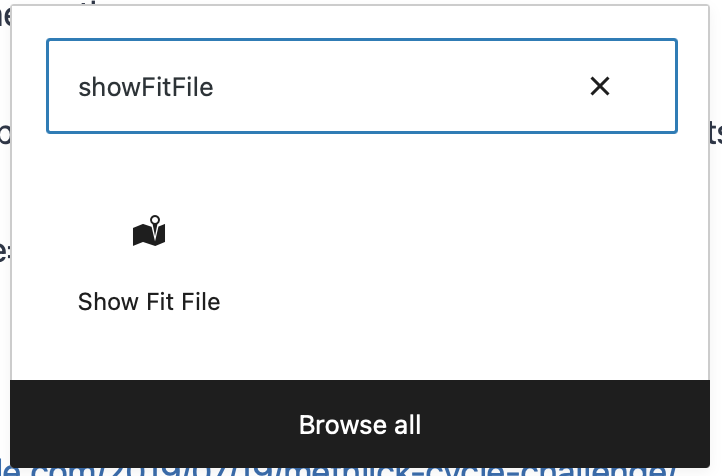
You'll see the ShowFitFile block appear. Click on it, and it'll be inserted into your post.
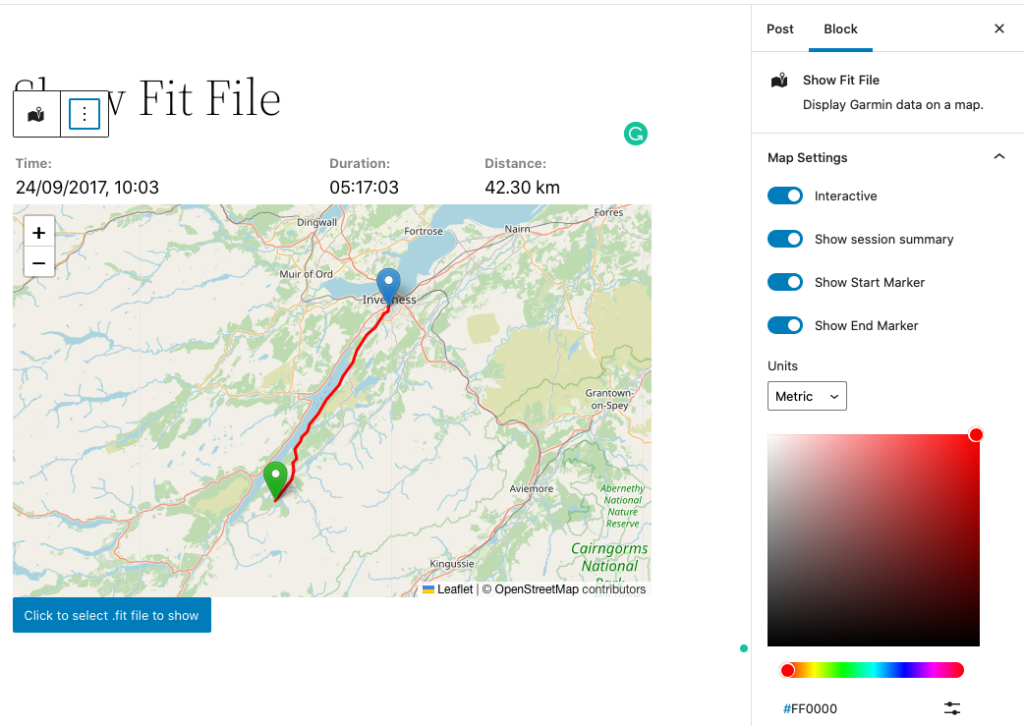
When the block initially loads, it'll show a map of central London. To display a fit file, click on the blue button below the map, and select a file. After a few seconds, the file will be displayed on the map. Click on the block, and you'll get a series of options displayed in the sidebar.
Options
Interactive - this determines if the map can be scrolled and zoomed
Show Session Summary - toggles on or off the table above the map with the time, duration & distance of the file
Show Start Marker/Show End Marker - these options show or hide the green and blue markers that indicate the start and end points of the route.
Units - Sets the distance shown in the summary table to metric (km) or Imperial (miles)
Line Colour - sets the colour used to display the route line on the map
Shortcode
The basic shortcode is [showfitfile file = "xxx.fit"] where, xxx.fit is the name of the .fit file, already uploaded to the media library. Note that any spaces in the filename will be replaced with '-' during the upload to WordPress.
Options
Interactive, yes/no, defaults to no. This set whether or not the graph can be scrolled or zoomed when it is displayed in the blog post.
Colour. Defaults to Red. Sets the colour of the route line on the map
Units: Defaults to Metric. determines if the summary above the map is shown in metric or imperial units.
[showfitfile file = "Loch-Ness-Marathon.fit" interactive="yes" colour="green" units="imperial"]
Examples
The Methlick Cycle Challenge – https://stuarttevendale.com/2019/07/19/methlick-cycle-challenge/
Show the basic route map + summary data using plugin defaults:
[showfitfile file = "2019-07-14-10-32-10.fit"]
Time: 14-Jul-19 10:32 am |
Duration: 03:37:44
| Distance: 63.14 km |
Loch Ness Marathon – https://stuarttevendale.com/2017/10/26/loch-ness-marathon/
Shows the route on an interactive map, with a blue route line & the session details in miles.
[showfitfile file = "Loch-Ness-Marathon.fit" interactive="yes" colour="blue" units="imperial"]
Time: 24-Sep-17 10:03 am |
Duration: 05:17:03
| Distance: 26.28 miles |
Components Used
The Shortcode plugin uses LeafletJS maps and phpFITFileAnalysis from https://github.com/adriangibbons/phpFITFileAnalysis, php-geometry from https://github.com/gregallensworth/PHP-Geometry and https://github.com/pointhi/leaflet-color-markers.
For the Block, it's based on Leaflet-React, curvereduce-js, and jimmykane/fit-parser garmin/fitsdk to decode and import the fit file data.
Source Code
ShowFitFile is an open-source project. The sourcecode is available here: https://github.com/tevendale/ShowFitFile
Support
If you've got any problems or questions, please don't hesitate to get in touch - stuart@yellowfield.co.uk